
I was researching open source and advocacy when I came across an interesting blog post about networks on the Visualising Information for Advocacy website. Written by Mushon Zer-Aviv, just a few weeks ago, it is a discussion exploring our concept of networks, and how the current trends in the visualisation of networks are missing important factors, such as flow, narrative and directionality.
Zer-Aviv has done some very interesting work exploring the boundaries of interface and the biases of techno-culture as they are redrawn through politics, design and networks. As I’ve been researching, I’ve been enjoying discovering the counter-culture of digital activists, who are using technology and data for good public use. The article he wrote, was part of a series of blog posts published towards the Responsible Data Forum on Visualization #RDFviz that took place in New York on January 15th, 2016.
How the simplistic network diagram came to dominate our imagination and why we shouldn’t blindly go with the flow.
In the article Zer-Avis discusses the concept of the network diagram. Networks are the buzzword for the decade, in particular distributed networks, through the popularity of social networking platforms, collaboration and e-enterprise. Through Facebook, Twitter, LinkedIn, and other social software, we are all in a constant state of ‘networking’. Visualization of networking and data has become an industry in itself. “A sub-category in the science and design of data” now exists, purely devoted to the visualization of data. From infographs and cartograms to gifs and videos, all producing new and exciting visually graphic software, layouts and formats to “untangle the network and extend cognition.”
There is something extremely wonderful about the aesthetics of the nature diagram, its volume, its physics, its emergence, its power. It is like the rendering of a hidden truth suddenly emerging before our eyes and taking us behind the scenes of everything we want to see through it. (Zer-Avis, 2016)
Zer-Avis’s description of networks is spot on. As a visual learner, I am naturally draw and bedazzled by the array of visual possibilities for presenting information. For two of my modules, my winter assessments were in visual format: a pechakucha presentation and a video essay. As David McCandless says in his TEDTalk on The Beauty of Data Visualization, “visualizing data to see the patterns that matte, and designing the information so that it makes more sense”. Zer-Avis’s article contains other interesting features such as networking techniques used by law enforcement and journalists, but for this post, I am just sticking with the concepts of networks. Even in just this, it is difficult to define.

Example of an infograph by Jess3 [CC BY 2.0 ], via Wikimedia Commons
The article references Alex Galloway and Eugene Thacker, who have written a series of very interesting articles and books on networks, communication and media (that warrant further investigation). They defined a series of protocols: that would define all the conventional rules and standards that govern relationships within networks. They argued that “If networks are the structures that connect people, then protocols are the rules that make sure the connections actually work.”
“Networks” to any system of interrelationality, whether biological or informatic, organic or inorganic, technical or natural–with the ultimate goal of undoing the polar restrictiveness of these pairings. (Galloway 2004).
Networks include everything from informal personal contact networks, to formal strategic alliances. As I mentioned earlier, ‘networking’ is the buzzword in current business strategies, with Tweetups, LinkedIn groups, business breakfasts, etc. Rishi Chowdhury , writing in The Business Insider, believes “that networking is one of the most valuable uses of my time in terms of return—and not just in monetary terms”. Network models such as these are not just for business users, academics are now using networking for research, collaborative writing and peer reviews
We all think we know what a network is, or at least what a rough diagram of a network looks like. I like to go back to basics, however, to make sure I really understand an idea or concept. I found some very helpful explanations on Math Insight.
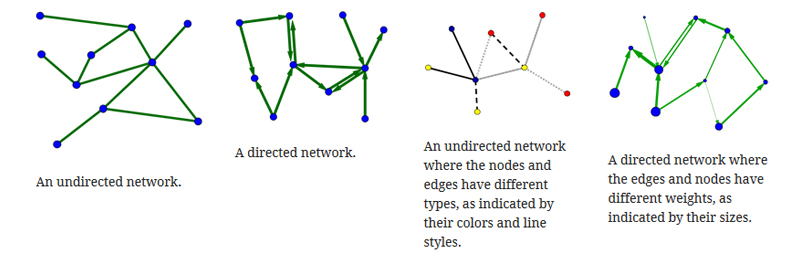
An introduction to networks by Duane Q. Nykamp licensed under Creative Commons
Here we can see two types of networks, directed or undirected. These can then change when the nodes and edges are different types. In the fourth diagram, the directed network, the edges and nodes have different weights. When Zer-Avis goes on to talk about how networks must be extended beyond nodes and edges to also include flows, directionality and (as per Galloway and Thacker) protocols, we can see through these models, the possibilities. That the current diagrams of networking models are restricted in their 2 dimensional format. Networks are now being used to describe social relationships, but if we look back to the mathematical models, we can see there are other factors we can take into account. I haven’t even mentioned network hubs yet! (Hubs are highly connected to other nodes in a network).

“Undirected Erdos-Renyi network.” From Math Insight licensed under Creative Commons
The potential for the development of network visualizations is limitless. Using methods and concepts such as Zer-Avis discusses, “ the potential for visualising network protocols is huge. Rather than aestheticize the opaque wonders of abstract networks, a humanistic visualisation could educate us about the protocols that govern us and potentially even provide us with the means to adjust them”
“When one tries to model systems such as those mentioned above, one quickly realizes that the simple network model with identical nodes and edges cannot describe important features of real networks”.
In my head, a network cannot be represented with a 2 dimensional model. It could be possibly 3D or 4D, hyperbolic, pulsating. With nodes and hubs to represent the past, the future, technology, edges and directionality to describe the ebb and flow. I’ve been searching to find a visualization or software that describes how I see a network. The exploration has uncovered a world of visualization tools, techniques and software. Visualising Advocacy have a great resource list on their website, such as D3.js, a free JavaScript library that can create a wide variety of creative charts, maps and diagrams which can then be embedded into web pages, or Gephi is an interactive tool for exploring, visualising and understanding large network graphs. I’ll admit I dont know understand how they work (yet!), but I find the visualizations beautiful. I’m compiling a list of ‘open source’ on Pinterest, included in this is types of graphic visualization and drawing software. You can find it here.
There is so much more to think about, and learn about the future possibilities of networks and data visualization, and the synchronisation of other digital tools. I am looking forward to trying out my own visualiztions, I can see myself and Gephi getting along nicely. Seeing how others have created visualisations is a great learning point, either the methods ot tools that they used. Here is an interesting video I came across by Nathan Miller. It is a Force-Based Data Visualisation using a combination of Slingshot! and Kangaroo Physics, “the video demonstrates the self-organization of a complex data set. The data being processed is the friend relationships on my Facebook network. This data is stored in a MySQL database and pulled into Grasshopper using Slingshot!”
References:
All quotes unless hyperlinked or in-line referenced come from Mushon Zer-Aviv and his article “If everything is a network, nothing is a network” published on January 8, 2016, on visualizingadvocacy.org
Further Reading:
Galloway, Alexander, Thacker, Eugene (2004) The Limits of Networking Web: Wed, 24 Mar 2004 Nettime.org <http://amsterdam.nettime.org/Lists-Archives/nettime-l-0403/msg00090.html>
Nykamp DQ, “An introduction to networks” From Math Insight.<http://mathinsight.org/image/small_undirected_network_labeled>licensed under a Creative Commons
is
So, what do you think ?