
A new skill I’d like to learn for presenting information and ideas is infographics. Infographics are “a visual representation of information or data, e.g. as a chart or diagram” (Wiki). Studies show that recognition doubles for a picture compared with text. From the 1930’s, visual information began with the Isotype which was developed at the Gesellschafts- und Wirtschaftsmuseum in Wien, Vienna. An isotype is a pictorial form, to help understand key elements. Isotypes are all around us, we have gotten so used to them, we don’t even think about them, their simplicity yet ability to convey important information, from road signs to toilet door signs.

An infographic is a developed form of isotype. Using visuals to create information that can be easily read, with better recall. Within the last decade infographics have become an increasing trend. In fact, from 2010 to 2012, infographic search volumes have increased over 800%. Current infographic design is centered around business and marketing, creating a visual point that makes you stand out from your competitors.
I wonder can it be use for education purposes. According to Dr. John Media, a developmental molecular biologist, vision is all powerful, and our memory is linked in with this visual dominance. His chart suggests you get much better recall if your information is both visual and oral. As a visual learner, I find it a great way for presenting information. I was wondering, however, can it be use to present information related to academic study, for articles to read on certain subjects. By creating the infographic I was combining close reading, with visual and technology literacies. With the development of e-learning, could this be used more as a tool for encouraging the use of technology and assessing what the students have learned?
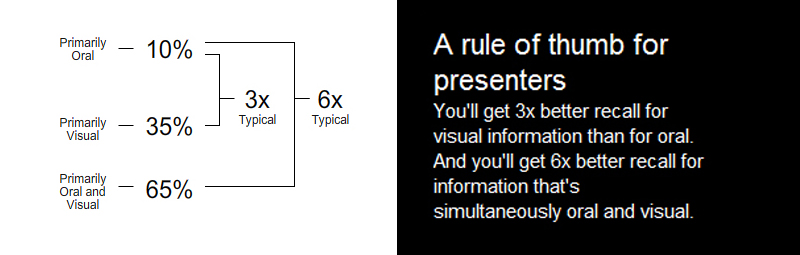
Rule of thumb for Presenters from brainrules.com
With this in mind, I decided to have a go at creating an infographic on ‘How to create and develop an online web persona’. I read several articles on academic blogging, extracted what I though were the key elements in creating an academic profile that will reflect not only my current work.
To create this infograph I used Canva, an online graphics programme, with a simple drag and drop feature. User friendly, it has a huge supply of graphic images and designs available to use. The free section is very adequate.
Extracting the relevant information into small soundbites was more difficult. I was able to isolate key correlate elements. Unfortunately you can’t add links to an infographic so I added in the articles I read and where to get them. I will add in proper links below.
Once the infographic was created I saved it into several formats, jpg, png and pdf, as I wasn’t sure how to embed it into wordpress. A quick search and a very useful article on hubspot, showed me how. (I uploaded the infographic to Pinterest and then through the widget builder on Pinterest, was able to get the pin code. It only works if you insert the code in the text/code side of the blog post)
My infographic is by no means perfect, but it made me link the articles, to create a more overall impression of the merits of not just creating your online persona but of curating it.
Further reading: “Creating and Maintaining a Professional Presence Online.” Ryan Cordell “Do You Need Your Own Website While On The Job Market?” Jentery Sayers “Creating Your Web Presence: A Primer for Academics” Miriam Posner “The academic online:Construction persona through the World Wide Web” by Kim Barbour and David Marshall “Critical Elements of Web Culture scholars should understand” by Dan Cohen
So, what do you think ?